USD/CAD Price Analysis: Sets for a smooth ride as oil continues bloodbath, US/Canada Employment data eyed
- USD/CAD is preparing for further side as oil prices continue to bleed amid fears of a global economic slowdown.
- Later this week, US/Canada Employment data will be keenly watched.
- USD/CAD is approaching the 61.8% Fibonacci retracement plotted at 1.3648.
The USD/CAD pair has turned sideways after a perpendicular rally to near 1.3630 in the early Asian session. The Loonie asset is gathering strength for further upside as a bloodbath in oil prices amid deepening fears of a global economic slowdown due to higher interest rates from central banks. The street is worried about the oil demand outlook as tight liquidity conditions would force firms to underutilize their production capacities.
Oil prices have refreshed their annual low of $63.60 after the Federal Reserve (Fed) hikes interest rates by 25 basis points (bps) to 5.00-5.25%.
Going forward, the Canadian Dollar will dance to the tunes of Friday’s Employment data (April). The net change in Employment is seen at 20K higher than the former addition of 34.7K. The Unemployment Rate is expected to increase to 5.1%.
Also, the US Employment data (April) will be keenly watched. The US Nonfarm Payrolls (NFP) data is seen at 179K lower than the former release of 236K.
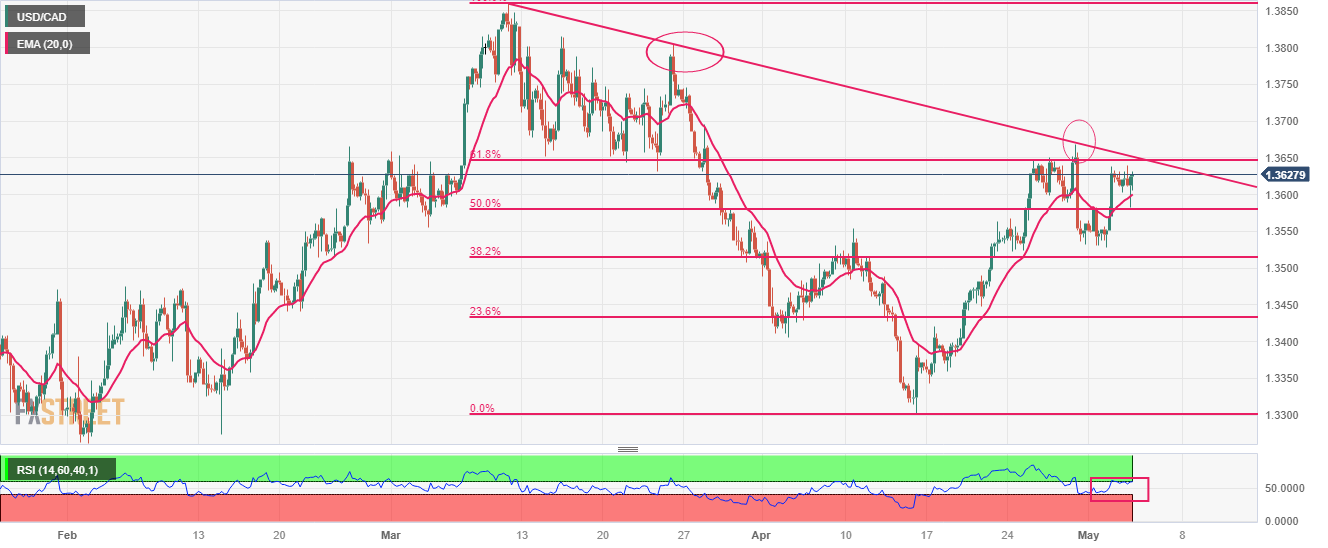
USD/CAD is approaching the 61.8% Fibonacci retracement (placed from March 10 high at 1.3862 to April 14 low at 1.3301) at 1.3648. The downward-sloping trendline from March 10 high at 1.3862 has acted as a major barricade for the US Dollar bulls.
The 20-period Exponential Moving Average (EMA) at 1.3600 is providing cushion to the US Dollar bulls.
Meanwhile, the Relative Strength Index (RSI) (14) is making efforts for shifting into the bullish range of 60.00-80.00. An occurrence of the same will activate the bullish momentum.
An extension in a recovery move above the 61.8% Fibo retracement at 1.3650 will trigger a reversal and will drive the major toward the round-level resistance at 1.3700. A break above the same will expose the asset to March 22 high at 1.3745.
On the flip side, a decisive break below May 02 low at 1.3529 will expose the asset to psychological support at 1.3500 followed by a 23.6% Fibo retracement at 1.3438.
USD/CAD four-hour chart