Confirming you are not from the U.S. or the Philippines

এই বিবৃতি দিয়ে, আমি স্পষ্টভাবে ঘোষণা এবং নিশ্চিত করছি যে:
  • আমি মার্কিন নাগরিক বা অধিবাসী নই
  • আমি ফিলিপাইনের বাসিন্দা নই
  • আমি প্রত্যক্ষ বা অপ্রত্যক্ষভাবে মার্কিন অধিবাসীদের10% এর বেশি শেয়ার/ ভোটাধিকার/ স্বার্থের মালিক নই এবং/ অথবা মার্কিন নাগরিকদের বা অদিবাসীদের অন্য উপায়ে নিয়ন্ত্রণ করি না
  • আমি শেয়ার/ ভোটাধিকার/ স্বার্থের 10% এরও বেশি বা প্রত্যক্ষ বা অপ্রত্যক্ষ মালিকানার আওতাধীন নই/ বা অন্য উপায়ে মার্কিন নাগরিক বা অধিবাসীদের নিয়ন্ত্রণে নেই
  • আমি FATCA-র ধারা 1504(a) অনুযায়ী মার্কিন যুক্তরাষ্ট্রের নাগরিকদের সাথে বা অধিবাসীদের সাথে সম্বন্ধযুক্ত নই
  • আমি মিথ্যা বিবৃতি দেওয়ার জন্য আমার দায়বদ্ধতা সম্পর্কে সচেতন।
এই বিবৃতিটির উদ্দেশ্যে, সমস্ত মার্কিন নির্ভরশীল দেশ এবং অঞ্চলগুলি মার্কিন যুক্তরাষ্ট্রের মূল ভূখণ্ডের সমান। আমি Octa মার্কেটস ইনকর্পোরেটেডকে, এর পরিচালক এবং আধিকারিকদের আমার বিবৃতি লঙ্ঘনের কারণে উত্থিত বা এর সাথে সম্পর্কিত যে কোনও দাবি মোকাবেলা করার বিরুদ্ধে তাদের রক্ষা করতে এবং নির্দোষ প্রমাণ করতে প্রতিশ্রুতিবদ্ধ।
আমরা আপনার গোপনীয়তা এবং আপনার ব্যক্তিগত তথ্যের নিরাপত্তার জন্য নিবেদিত। আমরা শুধুমাত্র আমাদের পণ্য এবং পরিষেবা সম্পর্কে বিশেষ অফার এবং গুরুত্বপূর্ণ তথ্য প্রদানের জন্য ইমেইল সংগ্রহ করি। আপনার ইমেইল ঠিকানা জমা দিয়ে, আপনি আমাদের কাছ থেকে এই ধরনের বার্তা পেতে সম্মত হোন। আপনি যদি সদস্যতা ত্যাগ করতে চান বা কোনো প্রশ্ন বা উদ্বেগ থাকলে, আমাদের গ্রাহক সহায়তায় লিখুন।
Octa trading broker
ট্রেডিং অ্যাকাউন্ট খুলুন
Test
Back

AUD/JPY Price Analysis: Slips below the 100-day SMA, outlook turns negative

  • The AUD/JPY is experiencing a downward shift at 96.18, seeing a 0.23% loss.
  • Indicators on the daily chart show a negative outlook as the cross now trades below the 20 and 100-day SMA.
  • Four-hour chart indicators are consolidating after hitting oversold conditions.

On Thursday's session, the AUD/JPY experienced a downturn, hovering at 96.18 after hitting a its lowest level since mid December near 95.50. The daily chart conveys a bearish hue with the sellers gaining substantial ground. Meanwhile, the four-hour chart indicators seem to have enter in a consolidation phase, following a dip into oversold territories.

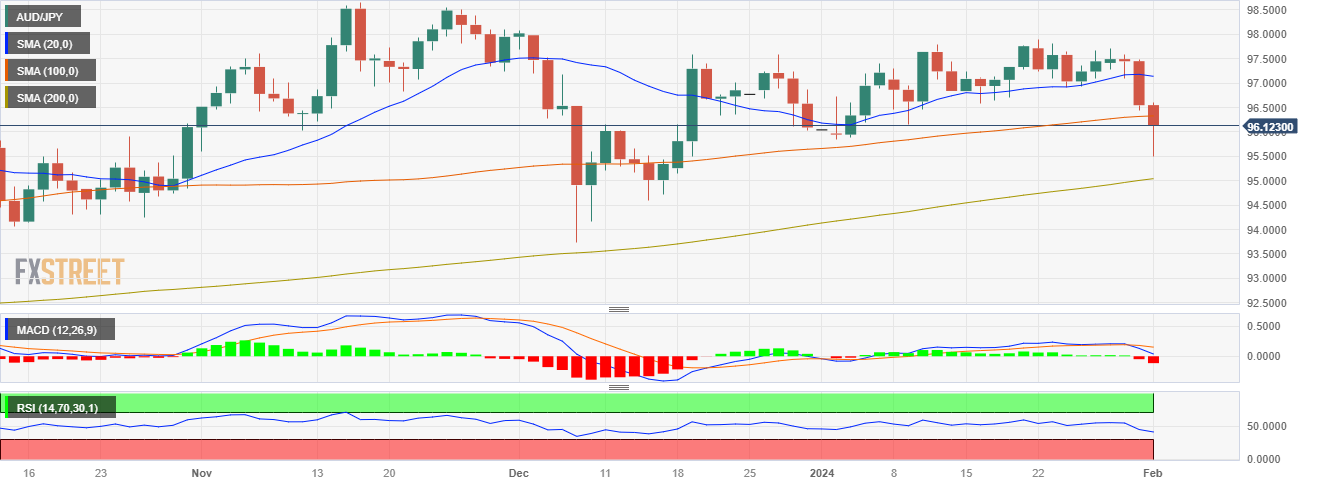
In the daily chart perspective, the leading indicators signal an inclined selling momentum. The Relative Strength Index (RSI) is charting a downward trajectory indicating bearish strength, especially within a negative zone. This is echoed by the Moving Average Convergence Divergence (MACD) which prints a surge in red bars, indicating increasing bearish pressure. Furthermore, the cross fell below the 100-day Simple Moving Average (SMA), a strong resistance which strengthens the case for the sellers .

Inspecting the shorter-term dynamics from the four-hour chart, it appears the bearish tendency seems to be leveling off. Indicators have moved to a stable phase after previously registering oversold conditions. The RSI in particular, maintains a flat formation in a negative territory, indicating a momentary pause in downward momentum. Additionally, the MACD also show flat red bars indicating growth in short-term selling pressure, though at a decreasing rate.

AUD/JPY daily chart

AUD/JPY levels to watch


EUR/USD roils in whippy trading as markets lean into NFP prep

EUR/USD dipped and recovered in a rough Thursday session, grinding lower in whipsaw action as the pair tests new lows in the near-term and slips further back from key technical levels.
আরও পড়ুন Previous

Silver Price Analysis: XAG/USD remains bearish despite reclaiming $23.00

Silver price rises late in the North American session as traders digest the latest central bank’s decisions across both sides of the Atlantic.
আরও পড়ুন Next