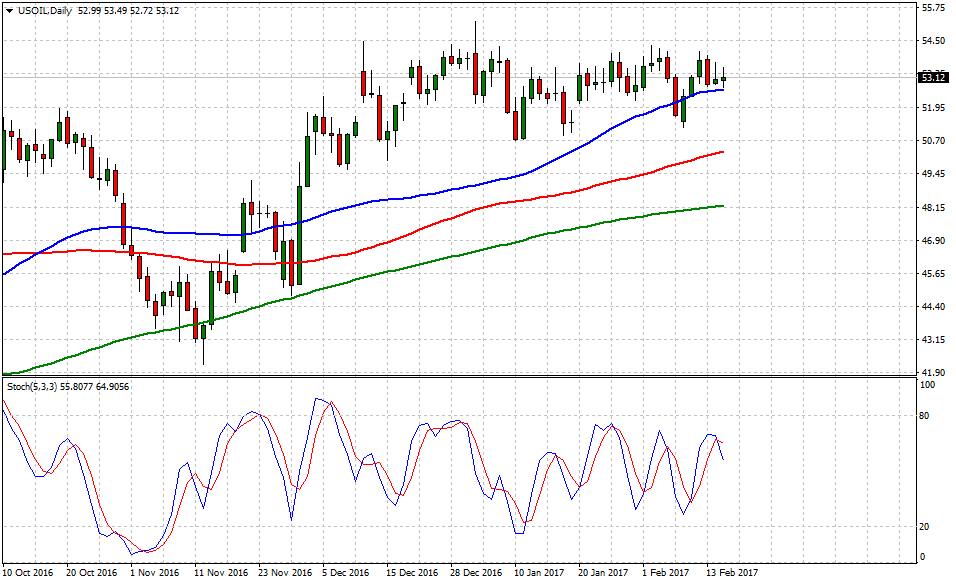
WTI vs. US dollar, on the edge vs. a pullback
WTI prices settled today above $53.00 mark as US crude stock rose 9.5 million barrels reported by the U.S. Energy Information Administration (EIA), this figure represents almost three times the forecast.
Recently, OPEC reported a 90% compliance in regards the recent 'output curbs' which is the first of its kind in 8-years. However, market sources indicate Iraq is only at a 40% compliance. On the other hand, Russia seems to register lower percentages on this matter too.
Furthermore, the US economic docket had a jam-packed day which delivered some serious positive figures across the board including Consumer Price Index at 2.5% and Retail Sales (MoM) at 0.4%, not spectacular or 'home runs' - clearly, consistent and healthy growth that pushed the following question; Are the odds moving to favor a March hike?
Market wrap: dollar fuelled by US data - Westpac
Technical levels to consider
In terms of technical levels, upside barriers are aligned at 54.30 (high Feb.2), and above that at 55.20 (high Jan.3). Later, supports are aligned at 52.60 (50-DMA), next at 50.20 (100-DMA) and finally below that at 48.20 (200-DMA).
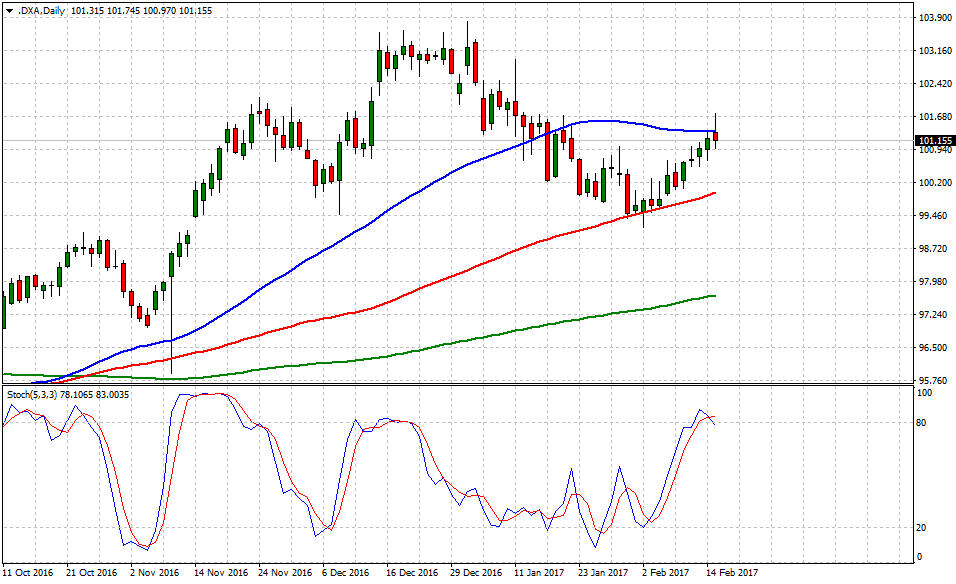
The greenback – gauged by the US Dollar Index seems muted 'at 50-DMA gates' which contributed to a sell-off across the board. However, the bullish tone hasn't been diluted as long as the buck holds 100.20 handle.
In term of technical levels, upside barriers are aligned at 101.74 (high Feb.15), then at 102.48 (high Jan.9) and above that at 103.20 (high Dec.23). Meanwhile, supports are aligned at 99.96 (100-DMA), later at 98.54 (low Nov.11) and finally below that at 97.54 (low No.8).
US CPI up, but trend looks moderate - Wells Fargo