Back
5 Nov 2019
US Dollar Index technical analysis: DXY is erasing last week’s losses, trading near 98.00 handle
- The US ISM Non-Manufacturing PMI rebounds to 54.7 and beat expectation helping DXY to add to its daily gains.
- The Greenback is gaining traction now challenging the 98.00 handle at the end of the London session.
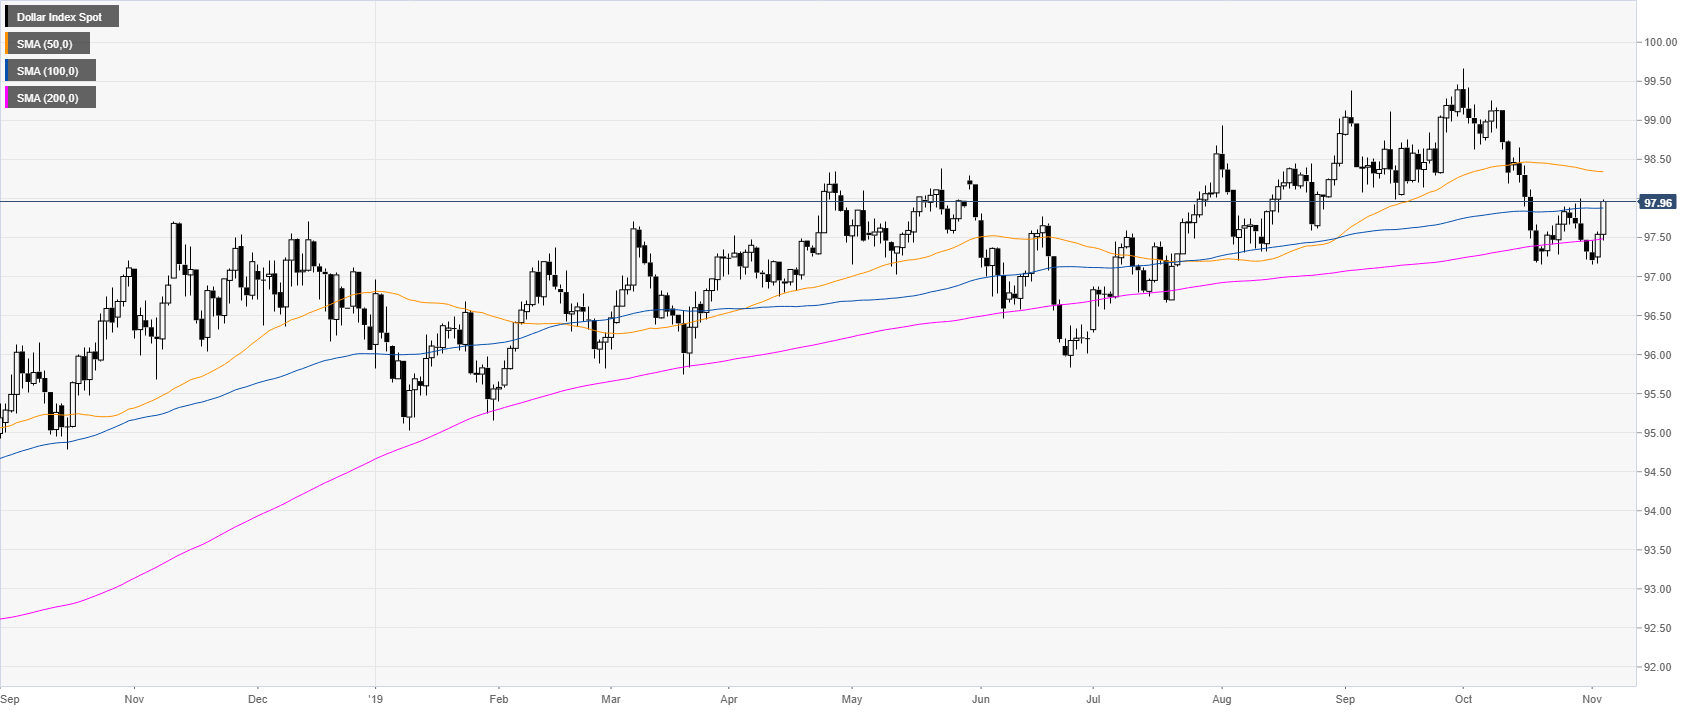
DXY daily chart
DXY is trading in a bull trend above its main SMAs. This Tuesday, the US ISM Non-Manufacturing PMI came in better-than-expected adding to the bullish momentum to the Greenback.
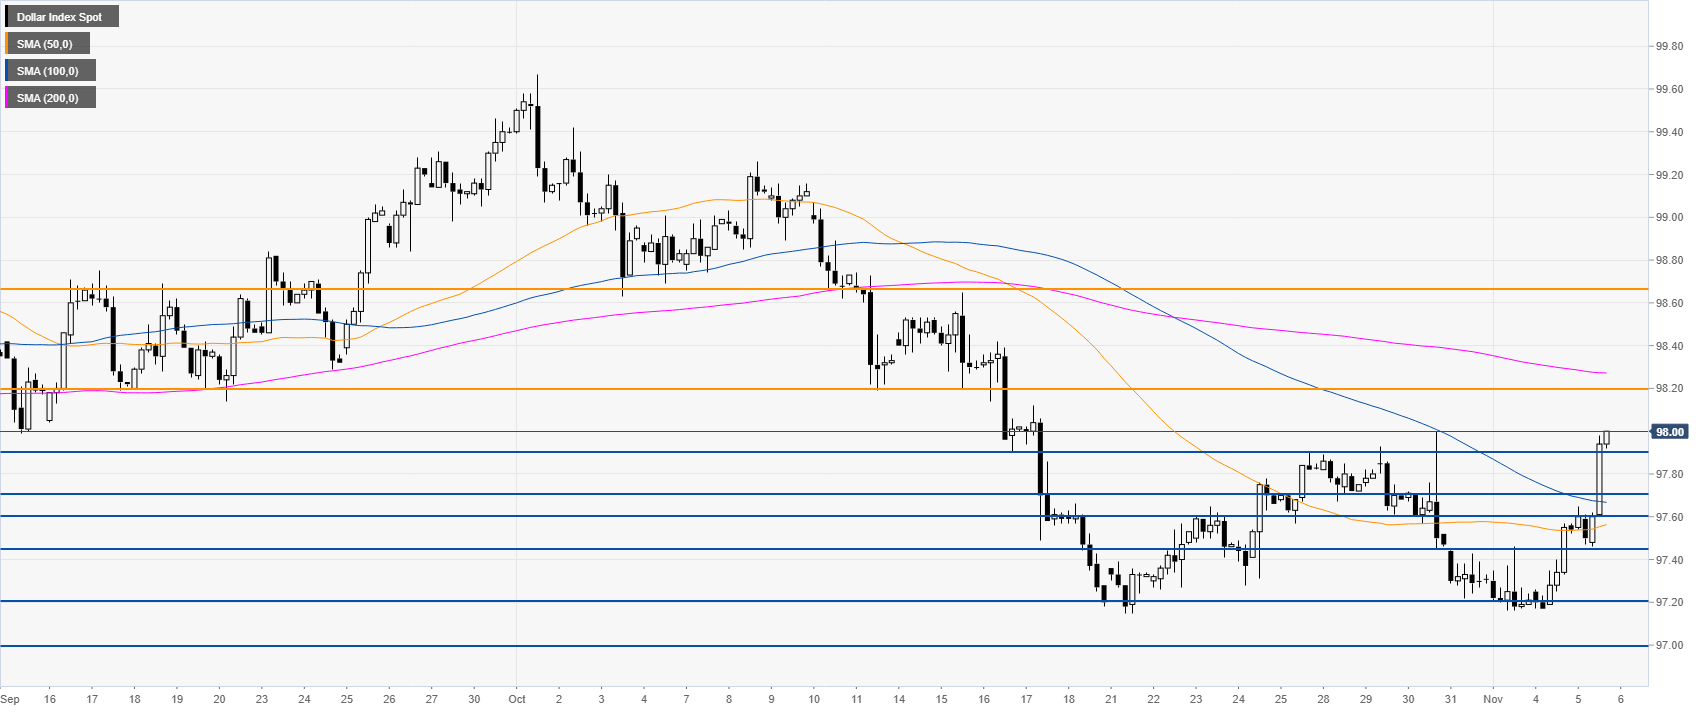
DXY 4-hour chart
The Greenback is trading above its 50 and 100 SMAs, suggesting potential bullish momentum in the medium term. A break above the 97.90 resistance should open the doors to further gains towards the 98.20 and 98.68 resistance levels.
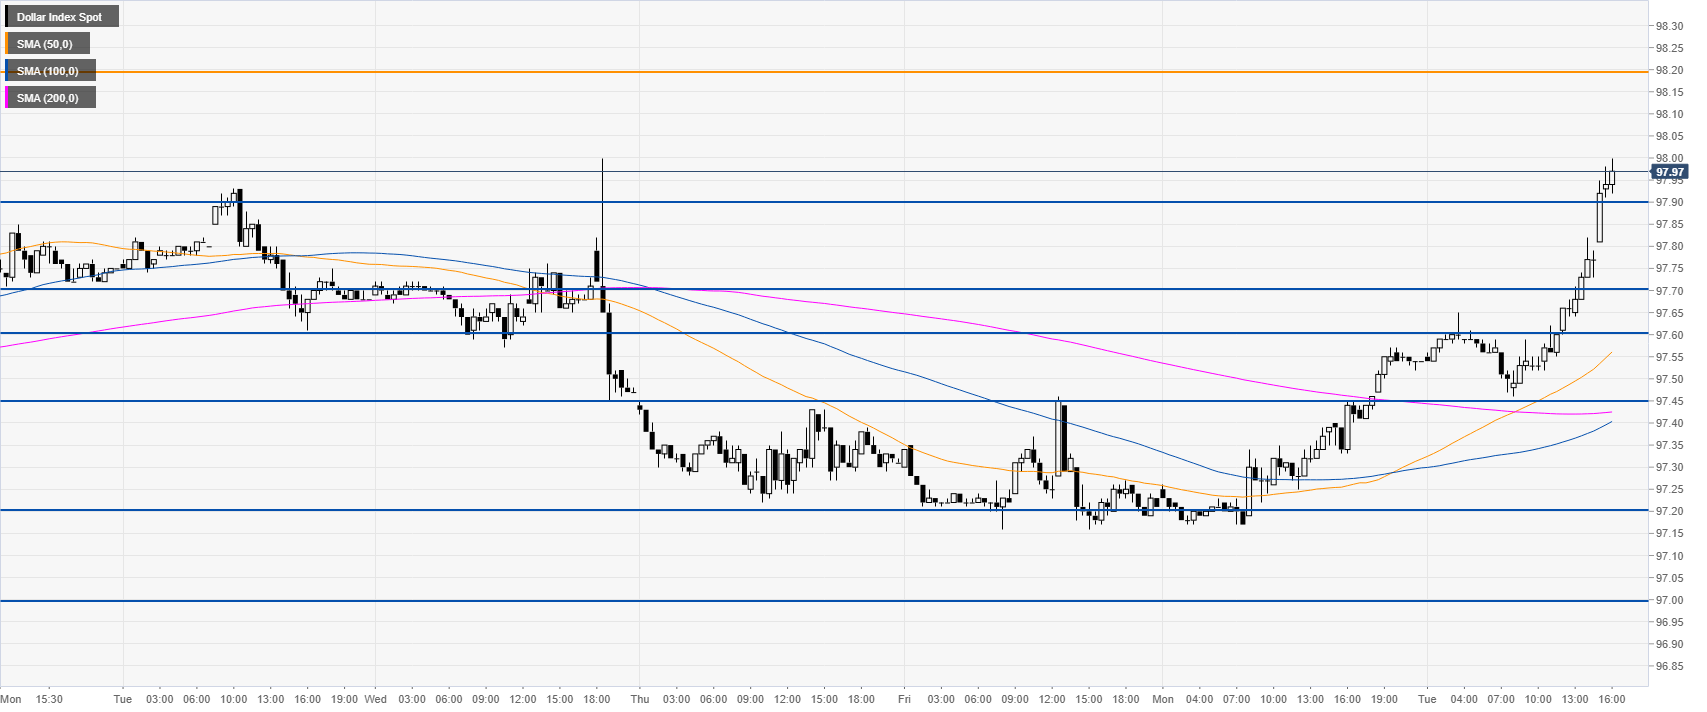
DXY 30-minute chart
DXY is trading above its main SMAs, suggesting a bullish bias in the short term. Support is seen at 97.90 level followed by 97.60/70 on the way down. The daily close above the 97.45 level is alleviating the bearish pressure seen in the last weeks.
Additional key levels