Back
21 Nov 2019
US Dollar Index Technical Analysis: DXY climbing to daily highs towards the 98.00 handle
- DXY is stabilizing in the 97.70-98.00 price zone.
- The level to buyers for bulls is the 98.00 handle followed by the 98.20 and 98.40 price levels.
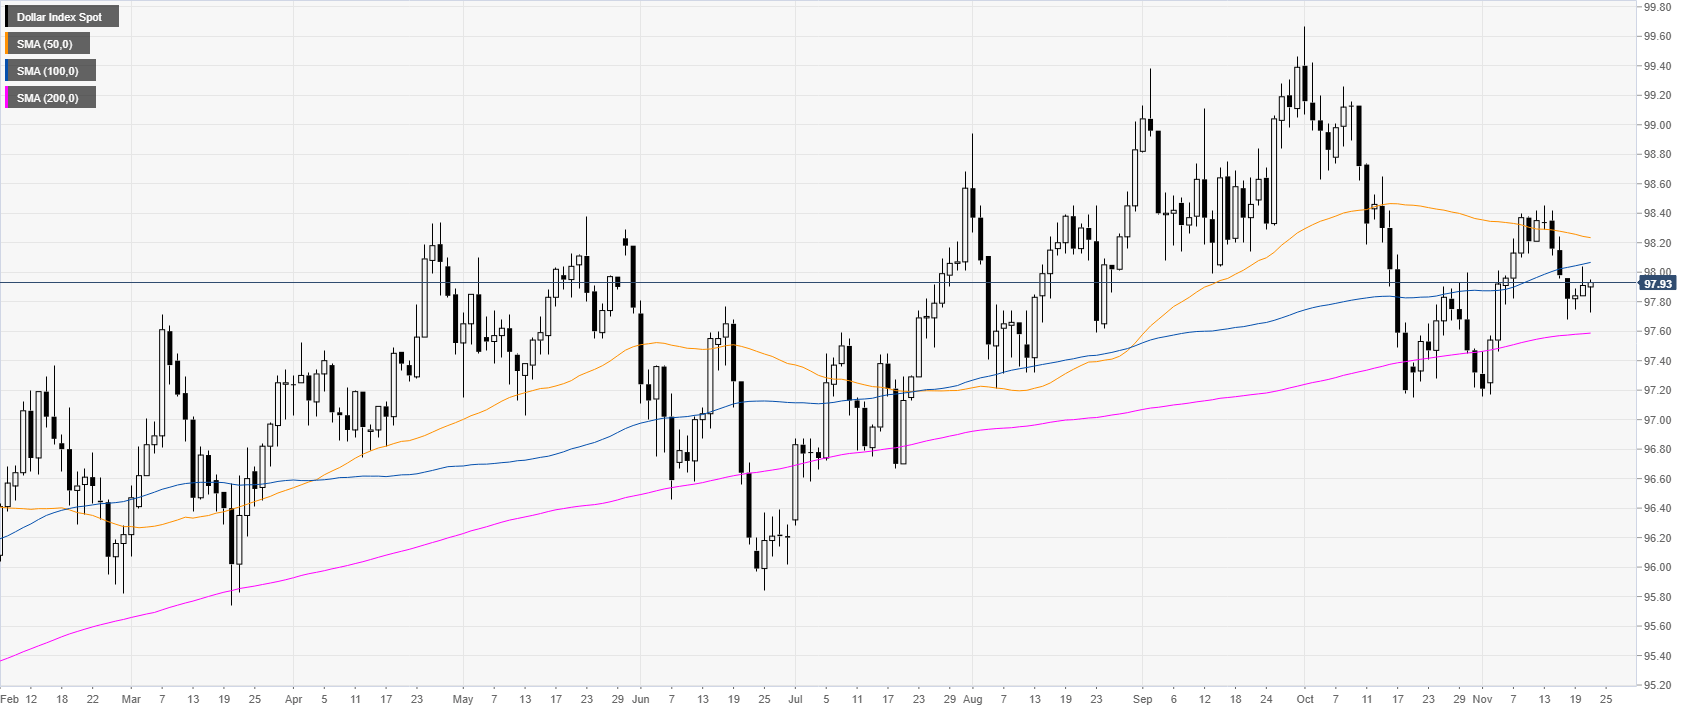
DXY daily chart
DXY (US Dollar Index) is trading in an uptrend above its 200-day simple moving average (DMA). This Thursday, the market is stabilizing in the 97.70-98.00 price zone.
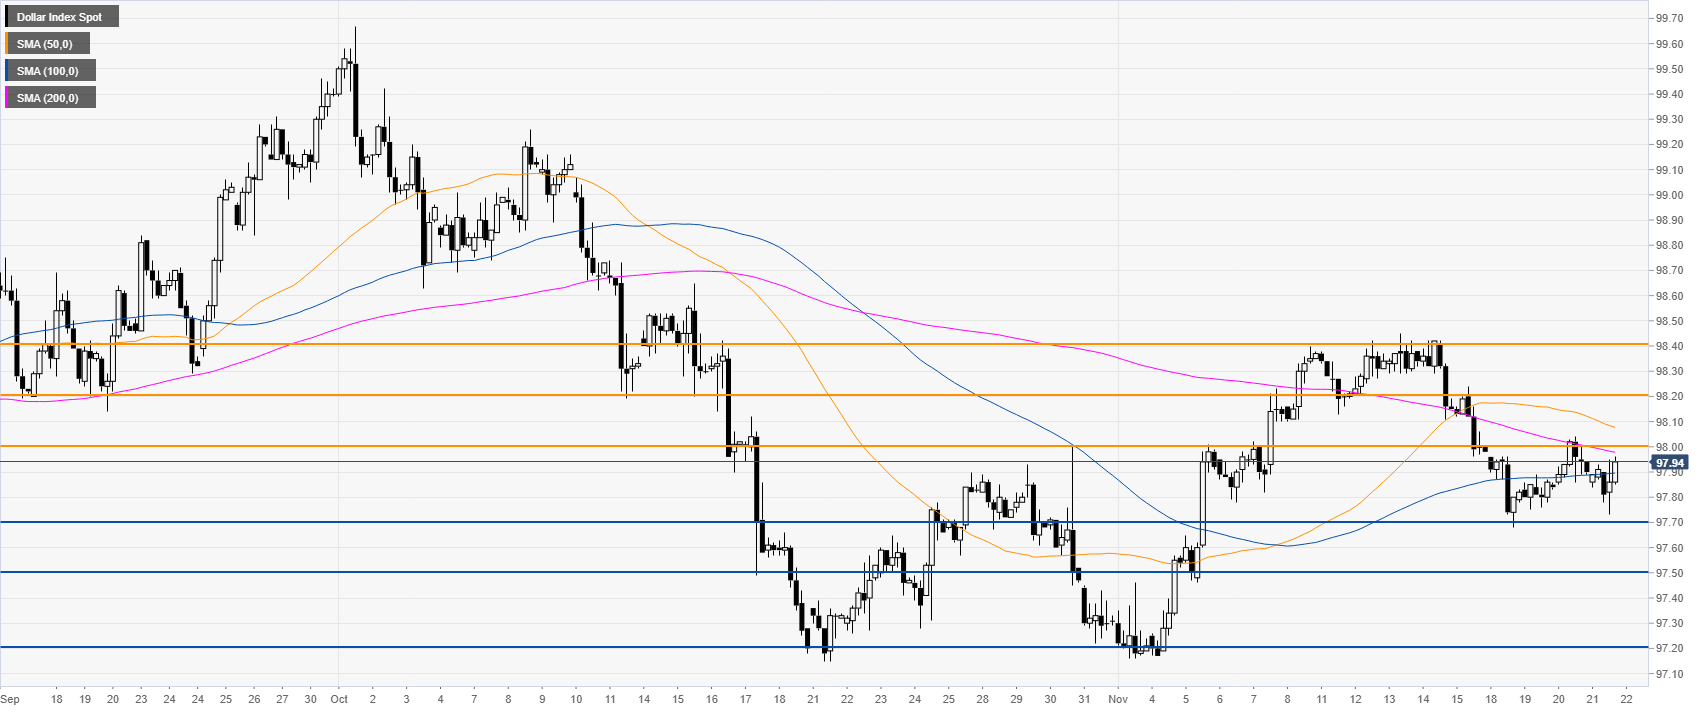
DXY 4-hour chart
DXY is consolidating in the 97.70-98.00 zone while below the 50 and 200 SMAs. From a bullish perspective, the market would need to trade above the 98.00 handle on a daily closing basis. If the bullish breakout is successful, the market could appreciate towards the 98.20 and 98.40, near the November highs.
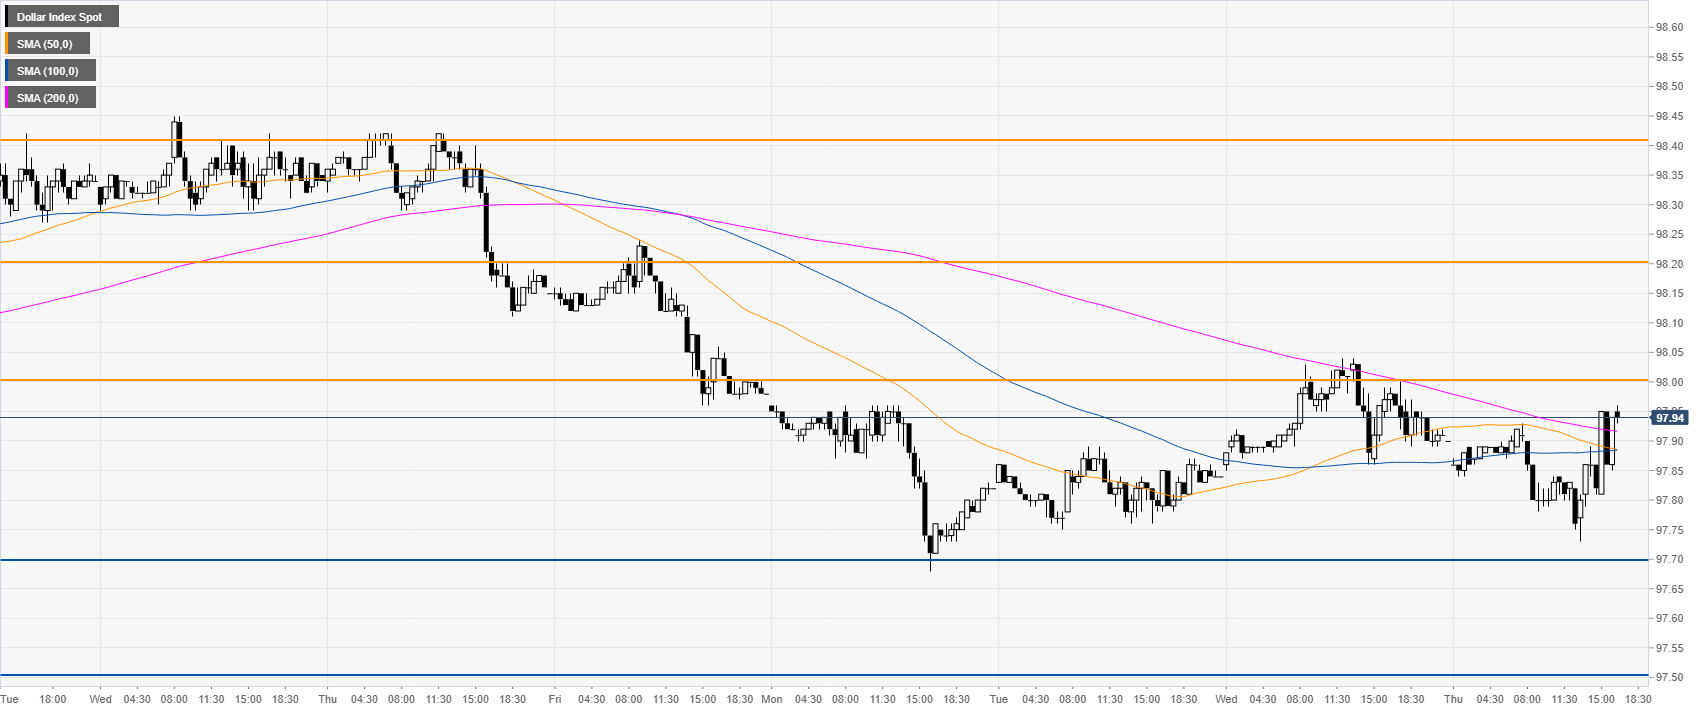
DXY 30-minute chart
The greenback is trading above the main SMAs, suggesting bullish momentum in the near term. Support is seen at the 97.70 level. However, a break below this level might lead to the 97.50 level.
Additional key levels