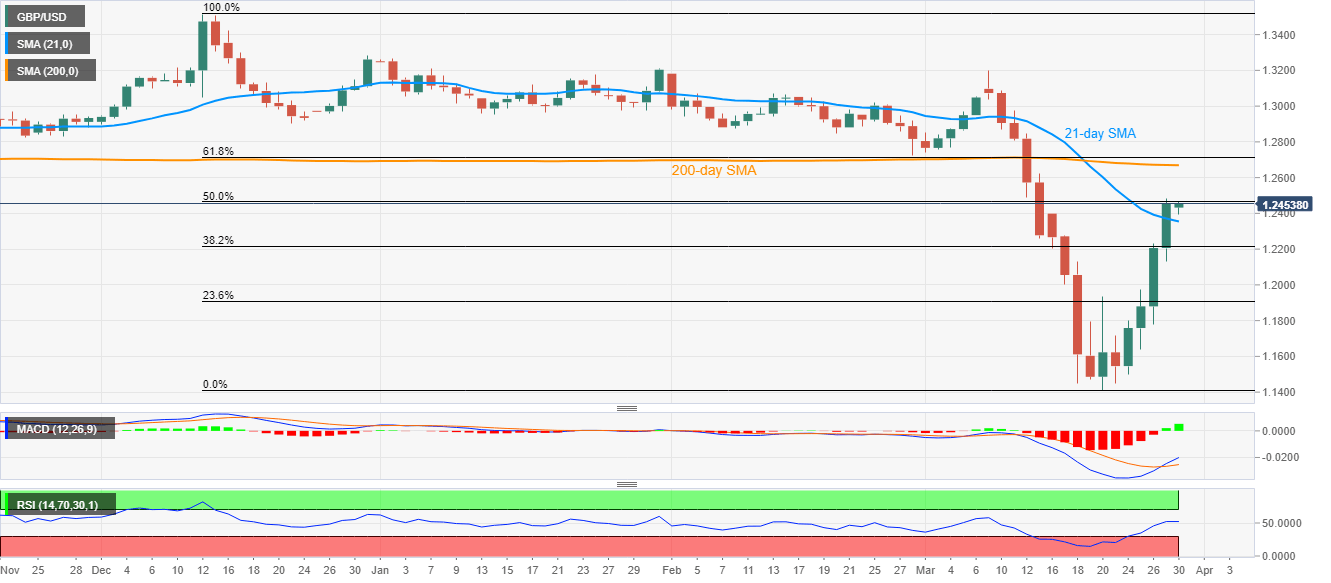
GBP/USD Price Analysis: Above 21-day SMA amid bullish MACD
- GBP/USD registers five-day winning streak, probes 50% Fibonacci retracement.
- A clear break of 21-day SMA, bullish MACD favor buyers.
- 200-day SMA, 61.8% Fibonacci retracement on the bulls’ radars.
While extending its run-up beyond 21-day SMA, GBP/USD takes the bids to 1.2460 amid Monday’s Asian session. In doing so, the quote confronts 50% Fibonacci retracement of its declines from December 12, 2019, amid bullish MACD.
Although a clear break of 1.2470 mark comprising 50% Fibonacci retracement becomes necessary for the buyers to justify their strength, major attention is given to the 200-day SMA level of 1.2670 during the further upside.
Additionally, 61.8% Fibonacci retracement level of 1.2715 will also act as an additional challenge to the buyers.
Meanwhile, a daily closing below 21-day SMA level of 1.2355 could drag the quote to a 38.2% Fibonacci retracement level of 1.2217 ahead of highlighting 1.2000 mark for the sellers.
GBP/USD daily chart

Trend: Further recovery expected
