US Dollar Index Price Analysis: DXY bulls battle 93.00 on their way to yearly top
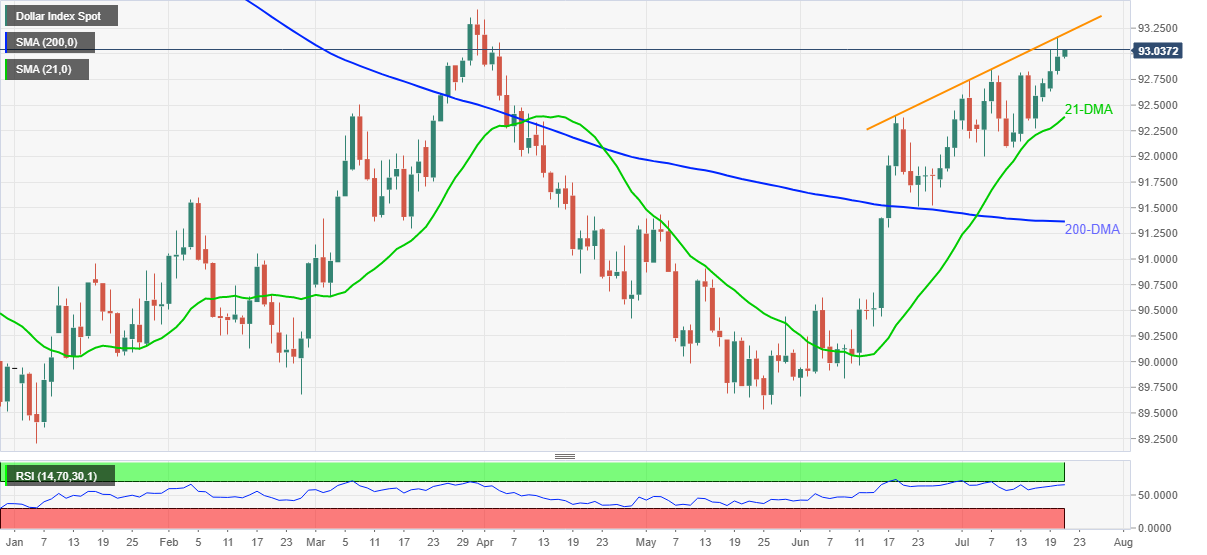
- DXY refreshes intraday top, reverses pullback from multi-day peak.
- Higher-high, sustained trading beyond the key moving averages back bulls.
- Monthly resistance line can act as immediate hurdle, 200-DMA becomes crucial support.
US Dollar Index (DXY) prints a five-day uptrend, taking bids around 93.00, during early Wednesday. In doing so, the greenback gauge rejects the previous day’s pullback from a one-month-old ascending resistance line.
A higher-high bullish formation and successful moves above 21-DMA and 200-DMA act as extra positives for DXY bulls.
Given the small difference between the RSI line’s current status and overbought conditions, the US Dollar Index may again attack the stated resistance line, near 93.20. However, any further upside won’t hesitate to challenge the yearly top of 93.43.
In doing so, October 2020 tops surrounding 93.90 and November’s high of 94.30 will be on the optimist’s radar.
On the contrary, pullback moves may aim for a 21-DMA level of 92.38 but will have to break the 93.00 threshold for that.
Even so, DXY bulls remain hopeful until the quote stay beyond the 200-DMA level of 91.36.
DXY: Daily chart
Trend: Bullish